
Nagios内置了很多脚本来监控服务。本篇会使用其中一些来检查通用服务如MySql、Apache、DNS等等。
为了保证本篇集中在系统监控,我们不会在这里配置主机组或者模板,它们已经在 前面的教程中覆盖了,它们可以满足需要了。

在命令行中运行Nagios
通常建议在添加到Nagios前,先在命令行中运行Nagios服务检测脚本。它会给出执行是否成功以及脚本的输出将会看上去的样子。
这些脚本存储在 /etc/nagios-plugins/config/ ,可执行文件在 /usr/lib/nagios/plugins/。
下面就是该怎么做
root@nagios:~# cd /etc/nagios-plugins/config/
提供的脚本包含了语法帮助。示例包含了部分输出。
root@nagios:~# cat /etc/nagios-plugins/config/tcp_udp.cfg
TCP OK - 0.000 second response time on port 80|time=0.000222s;;;0.000000;10.000000
示例拓扑
本片中使用下面三台服务器。每台服务器运行多个通用服务。Nagios服务器现在运行的是Ubuntu。
- Server 1 (10.10.10.1) : MySQL, Apache2
- Server 2 (10.10.10.2) : Postfix, Apache2
- Server 3 (10.10.10.3) : DNS
首先,这些服务器被定义在了Nagios中。
root@nagios:~# vim /etc/nagios3/conf.d/example.cfg
define service{
use         generic-service
host_name       test-server-1
;hostgroup can be used instead as well

service_description     Check MYSQL via TCP port
check_command           check_tcp!3306
        }

define service{
use             generic-service
host_name           test-server-1
;hostgroup can be used instead as well

service_description Check availability of database 'testDB'
check_command   check_mysql_database!nagios!nagios-pass!testDB
;check_mysql!userName!userPassword!databaseName
        }
这样,Nagios就可以同时监控MySQL服务器及其数据库的可用性。
监控Apache服务器
Nagios同样也可以监控Apache服务。
Apache监控需要
- 监控apache服务是否可用
这个任务非常简单因为Nagios有一个内置命令。
root@nagios:~# vim /etc/nagios3/conf.d/services_nagios2.cfg
## The -H portion can be modified to replace Google ##
define command{
command_name    check_dns
command_line    /usr/lib/nagios/plugins/check_dns -H www.google.com -s '$HOSTADDRESS$'
}
编辑下面的行。
root@nagios:~# vim /etc/nagios3/conf.d/services_nagios2.cfg
define service{
use                     generic-service
host_name               test-server-2
service_description     Check SMTP
check_command           check_smtp
        }

define service{
use                     generic-service
host_name               test-server-2
service_description     Check Mail Queue
check_command           check_mailq_postfix!50!100
                    ;warning at 50, critical at 100
        }
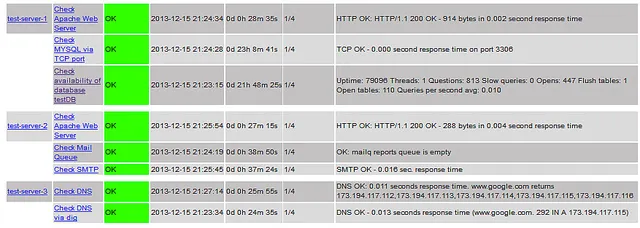
下面的截屏显示了目前配置监控服务的概览。
基于端口自定义监控程序
让我们假设如下定制程序同样运行在网络中,监听着一个特定的端口。
- 测试1号服务器:定制程序(TCP端口 12345)
做一些小的调整,Nagios也可以帮助我们监控这个程序。
root@nagios:~# vim /etc/nagios3/conf.d/services_nagios2.cfg
via: http://xmodulo.com/monitor-common-services-nagios.html
作者:Sarmed Rahman 译者:geekpi 校对:wxy
发表回复